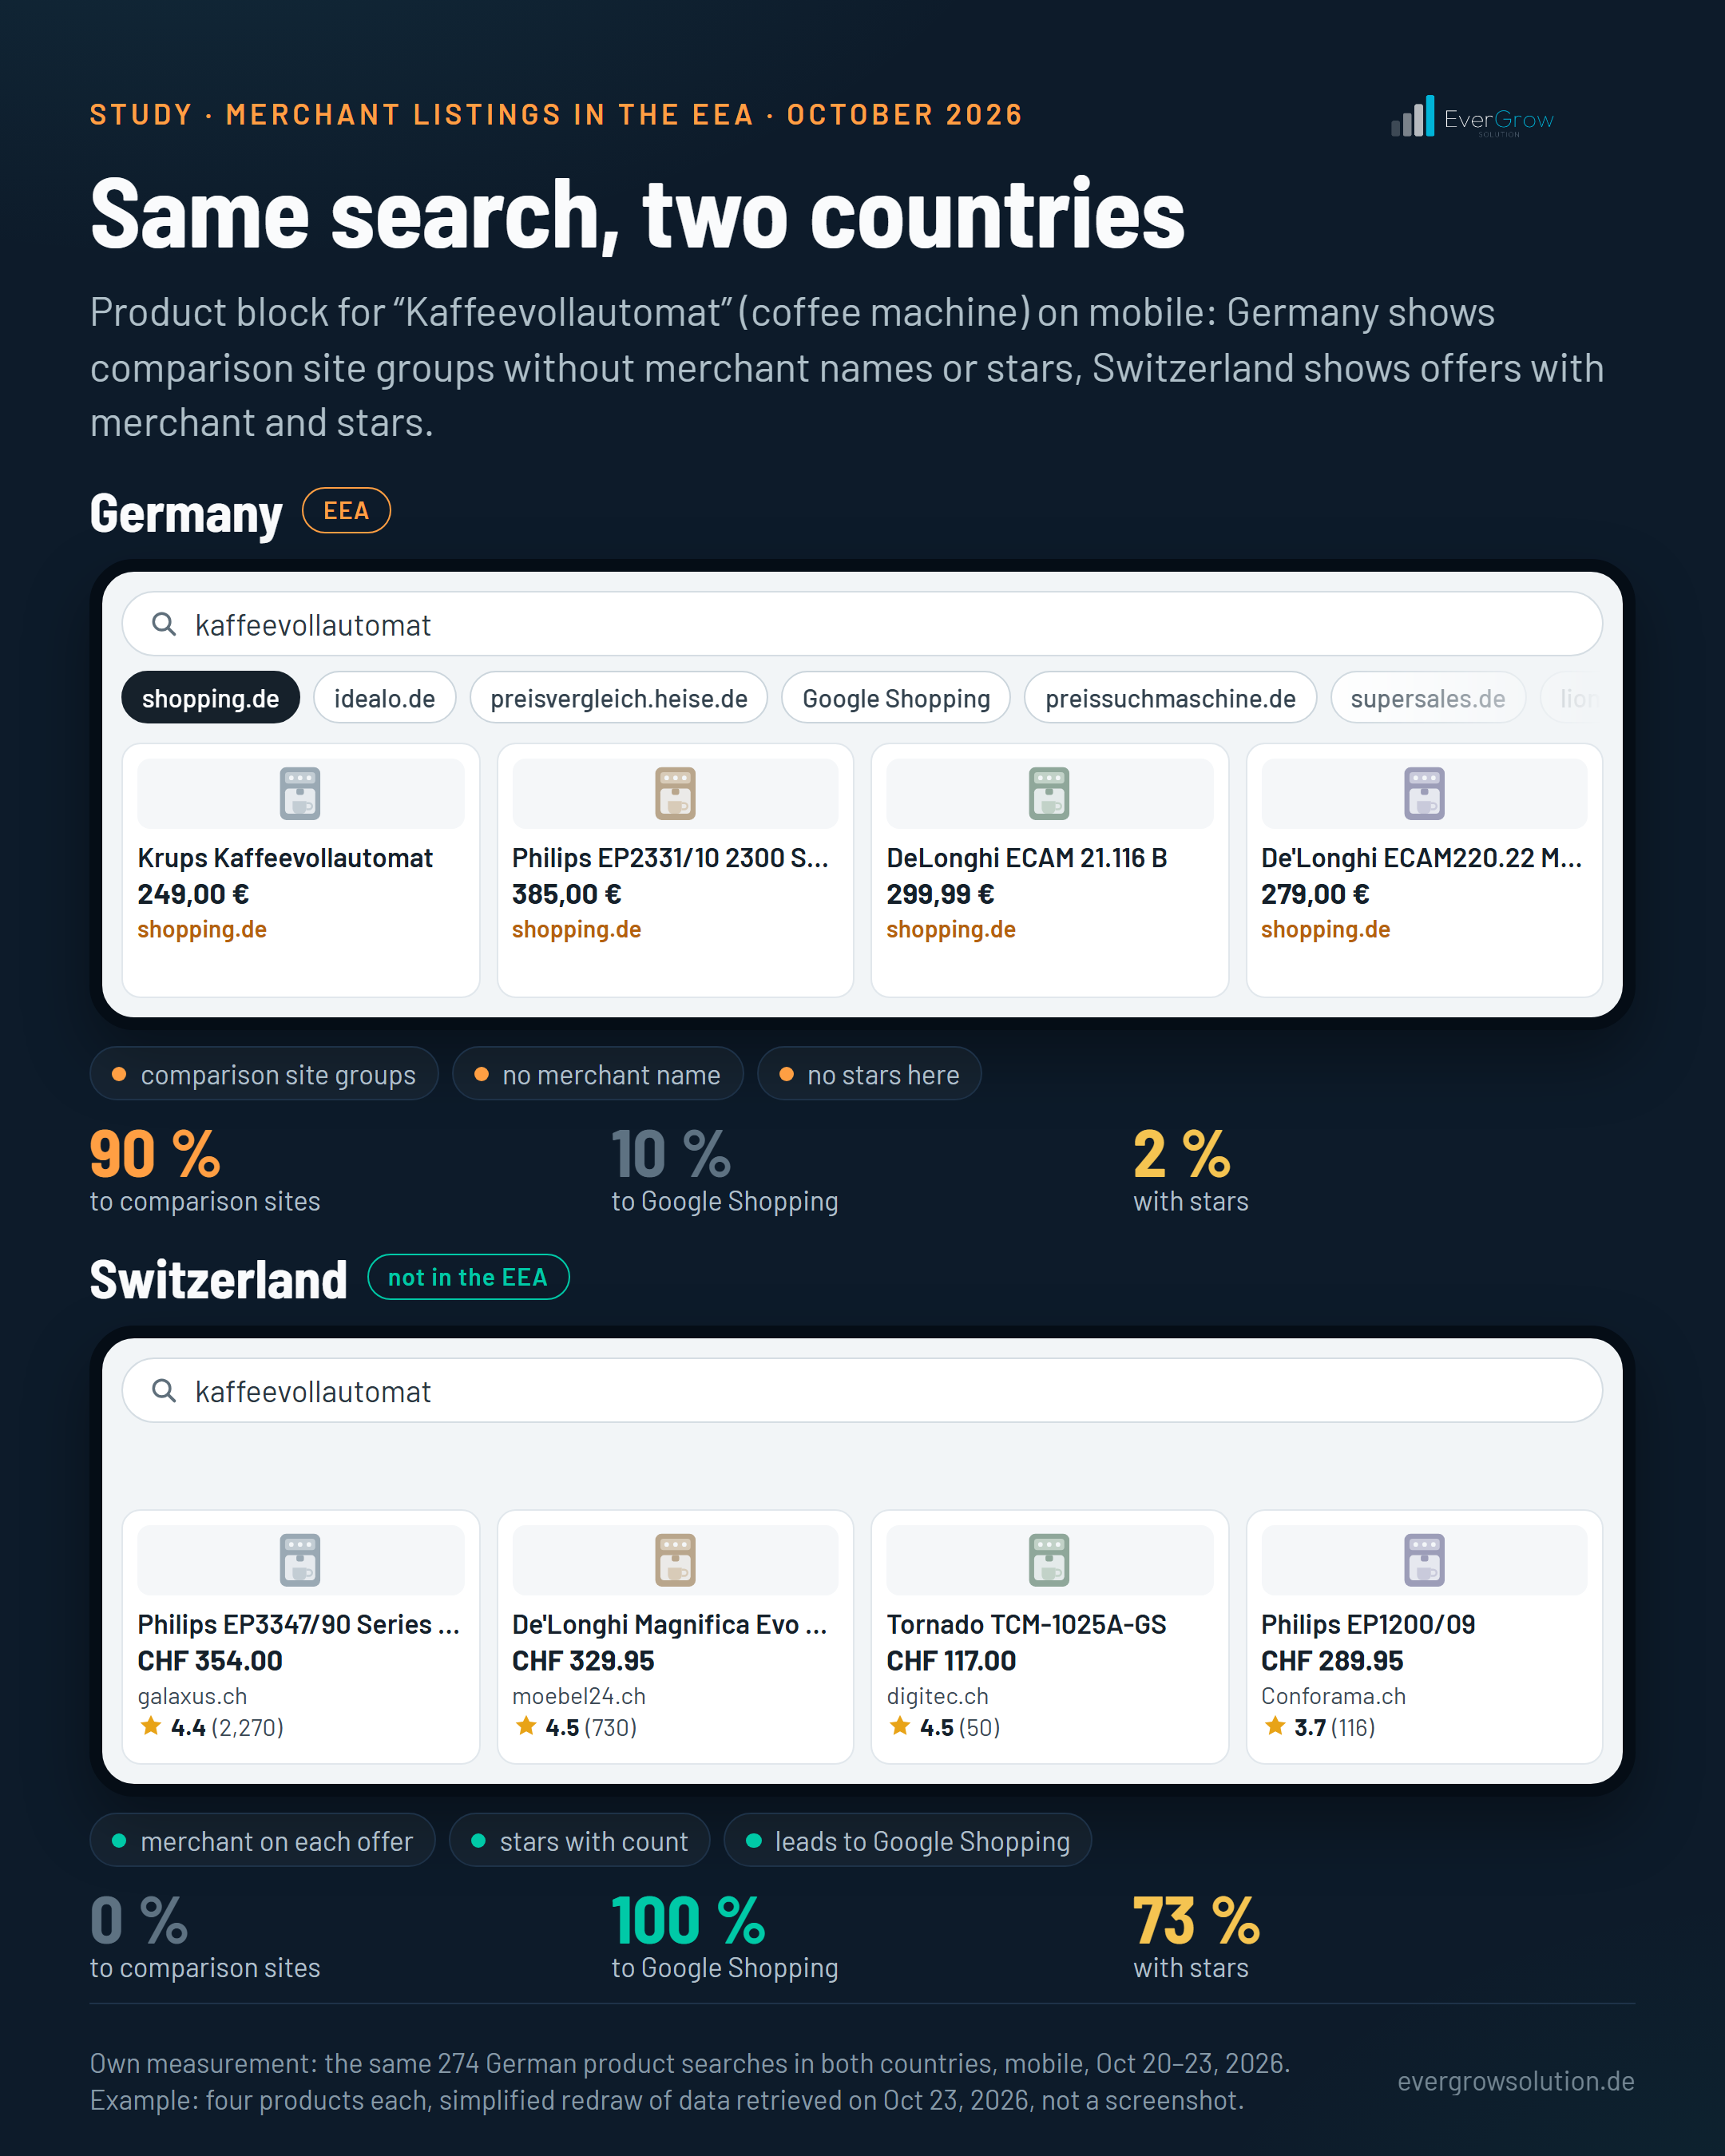
In mid-September, the carousels with merchants, prices and star ratings disappeared from product searches in Germany. According to Search Engine Roundtable, the tracker Productrise reported drops of 90 to 100 percent for product carousels. I wanted to know two things more precisely: who fills the space now, and what actually reaches a shop? So I measured the search results myself and put the data of a shop I work with side by side from two tools that seem to count the same thing and do not.
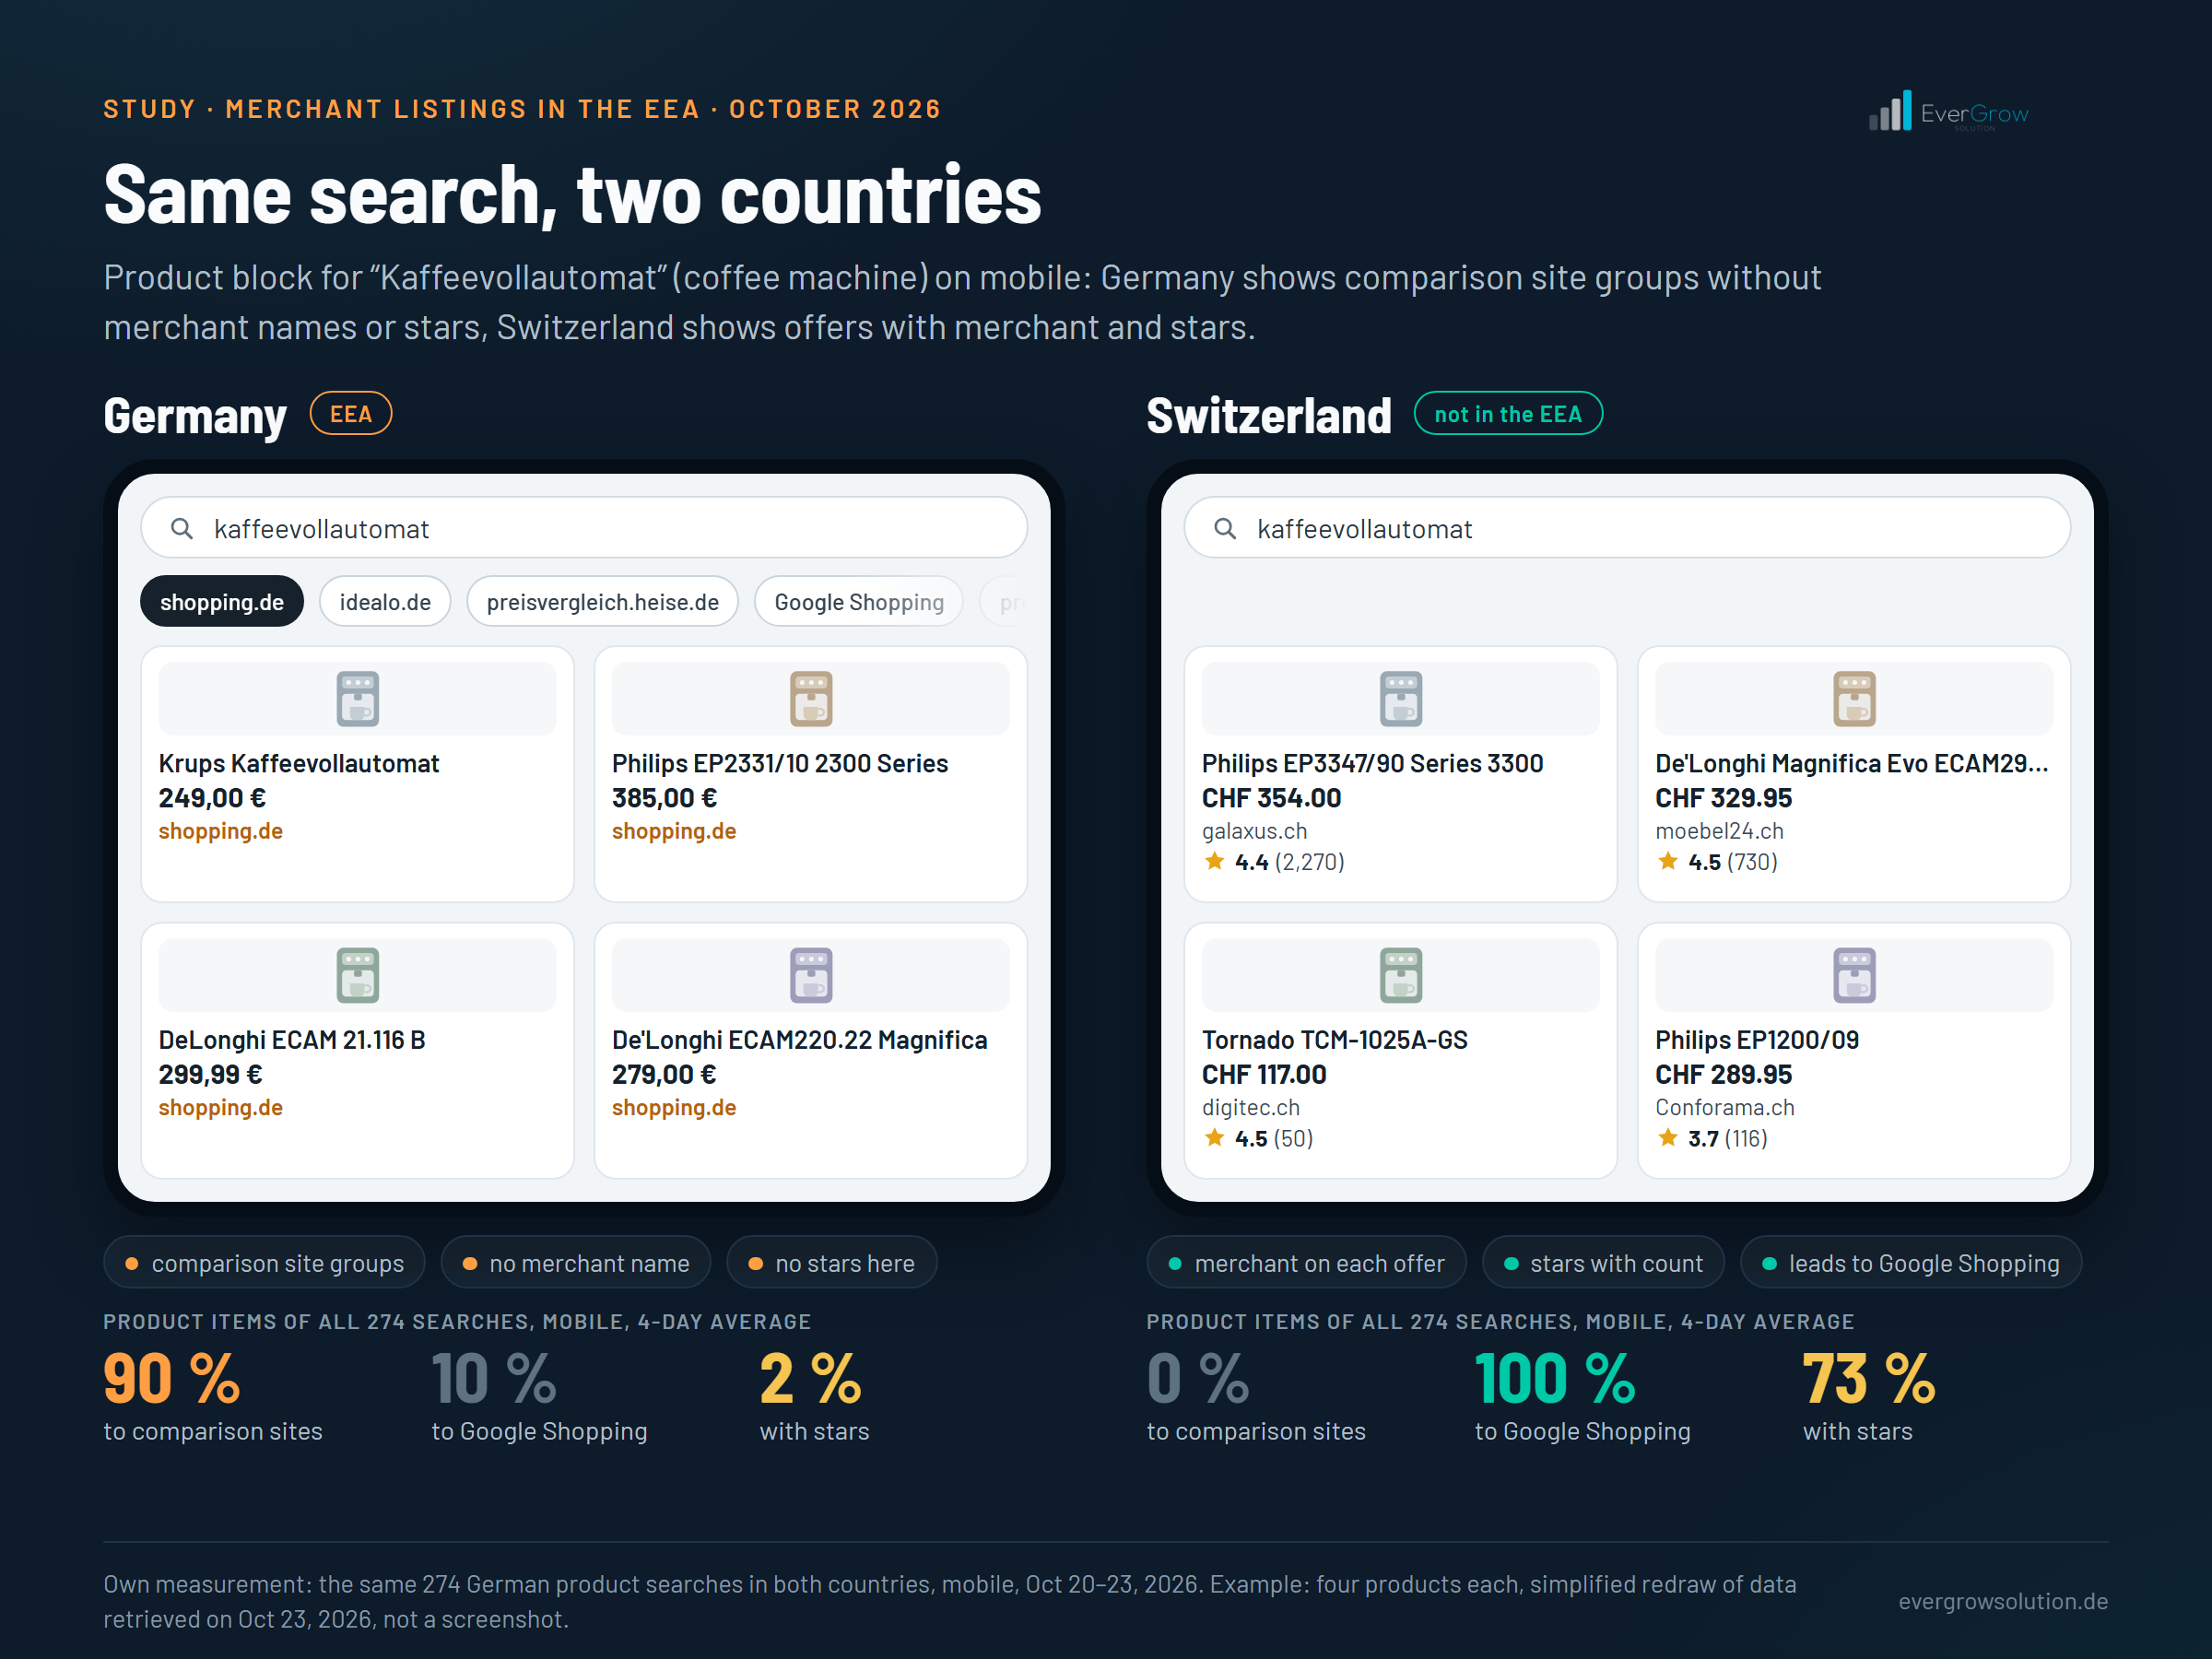
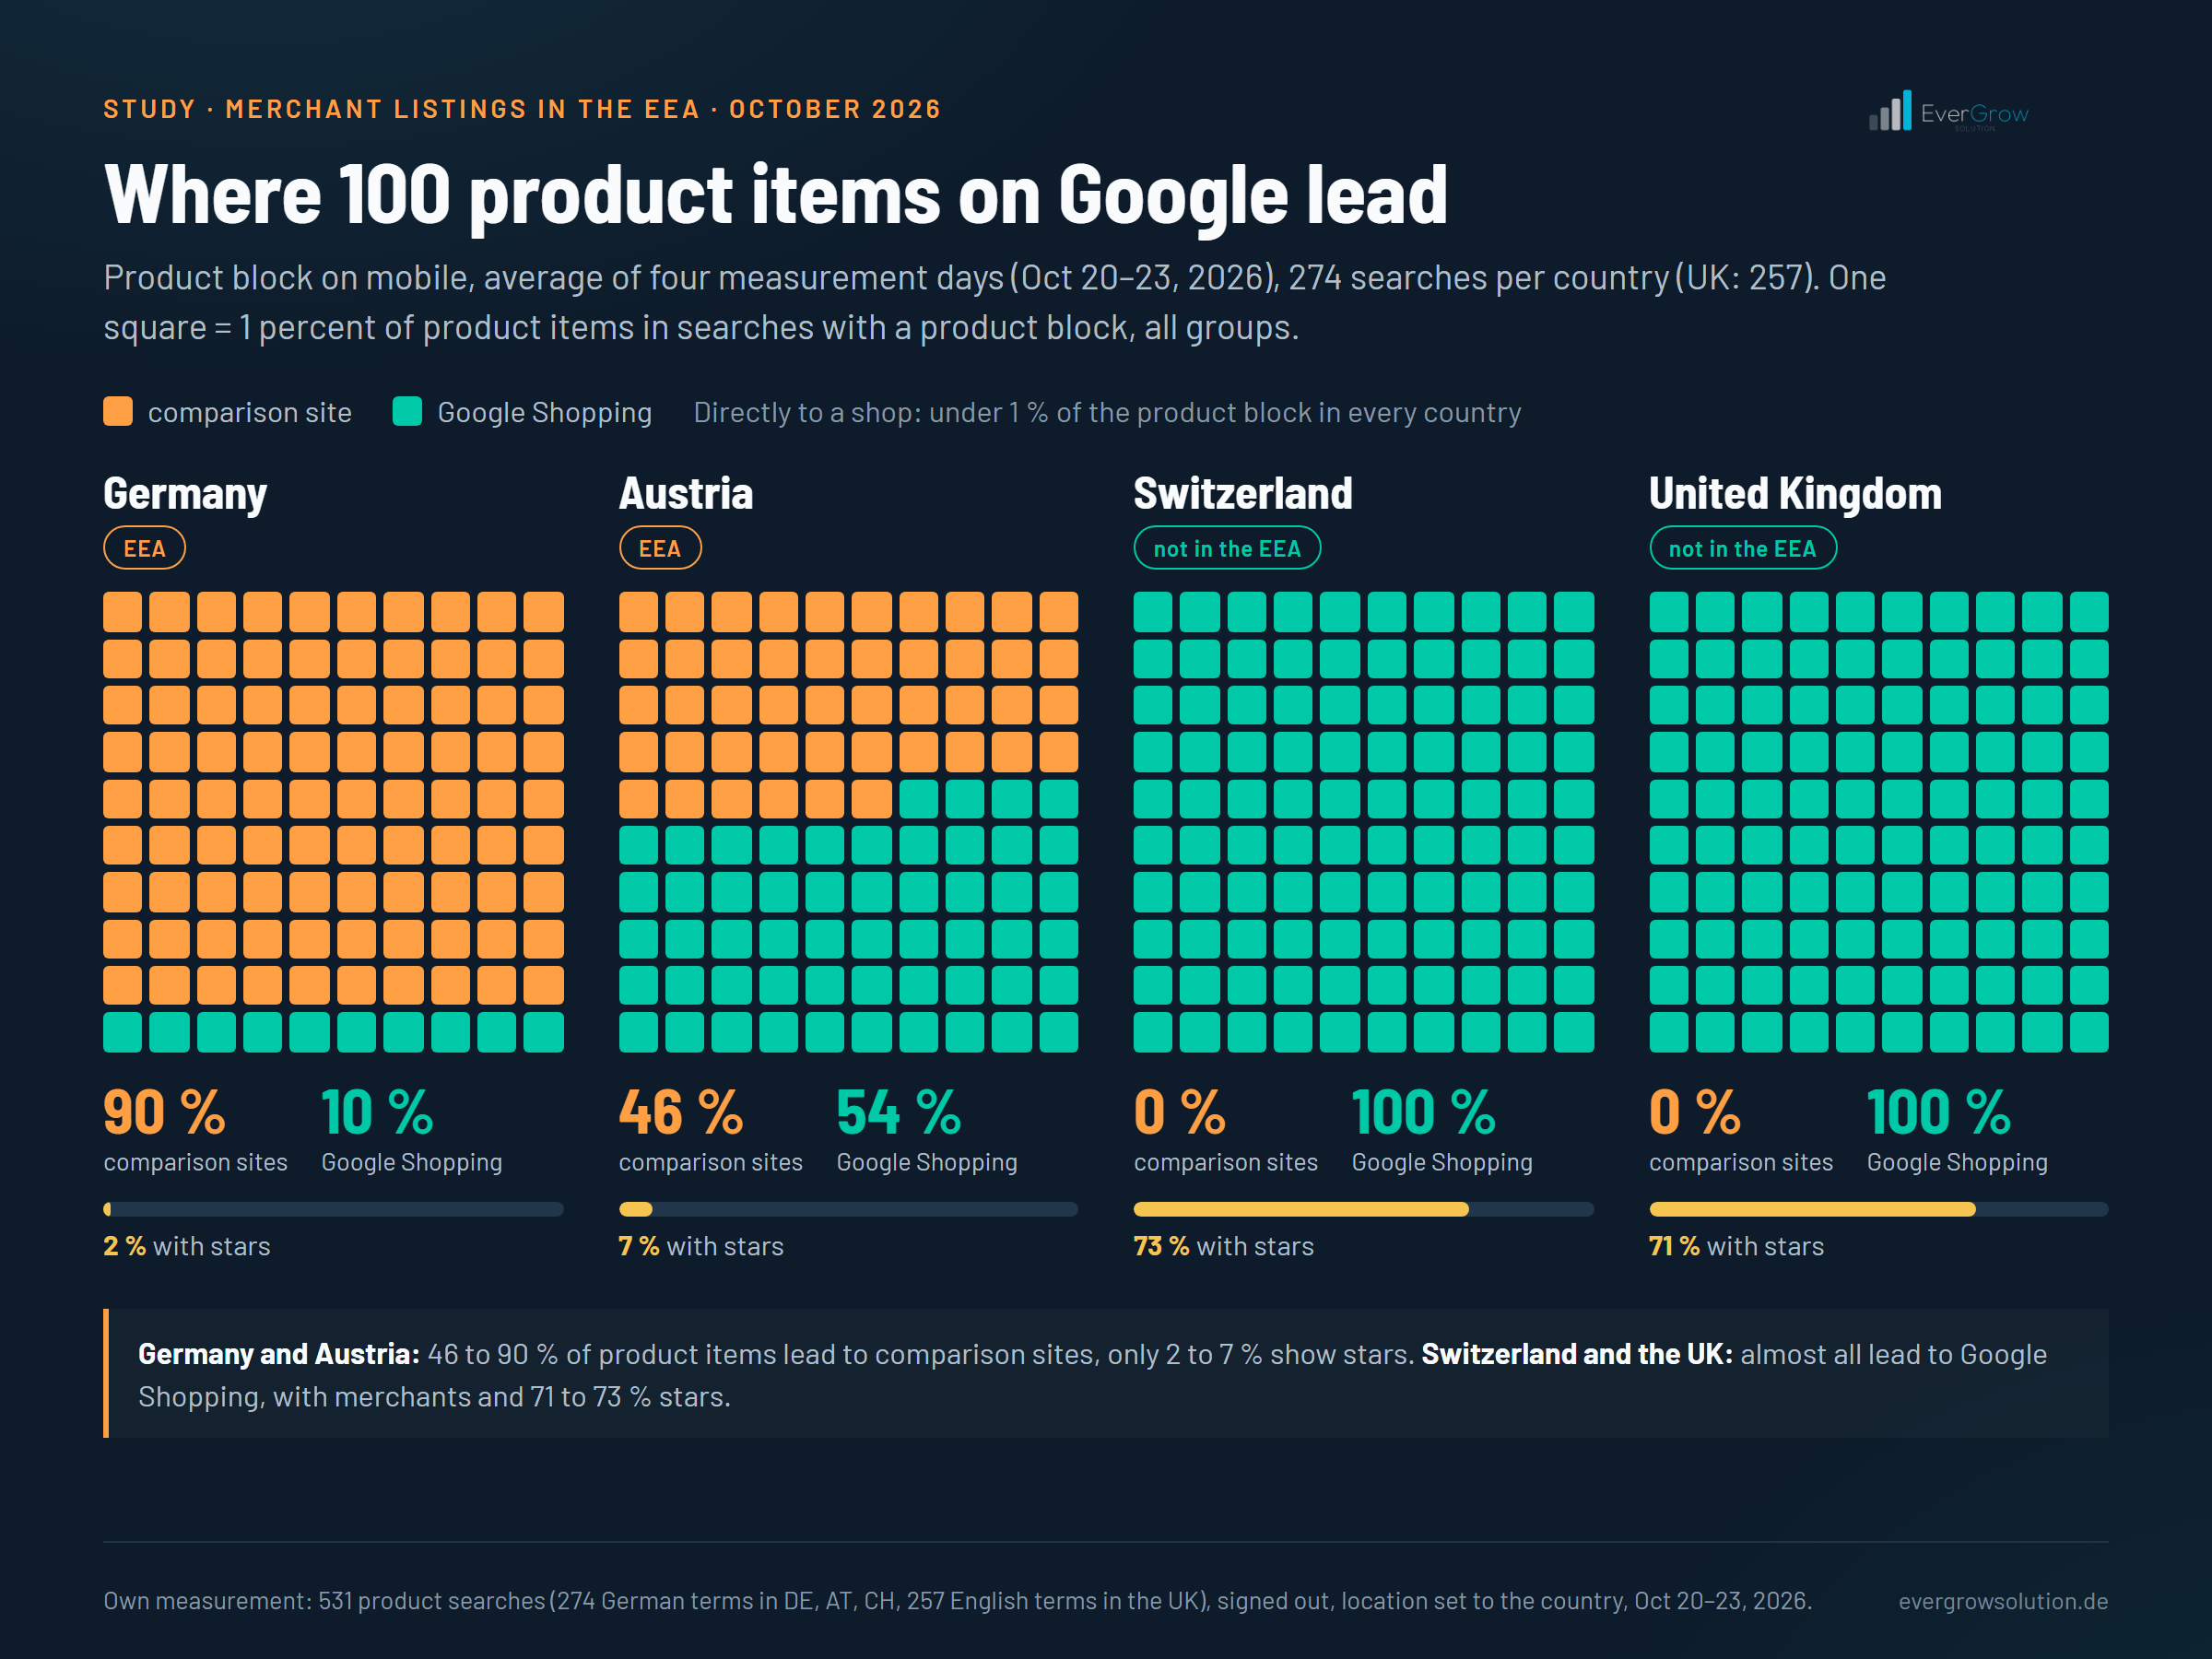
90 %
of product items in the German grid lead to comparison sites
mobile, all groups, average of four measurement days, range 89–91 %; Google Shopping: 10 %
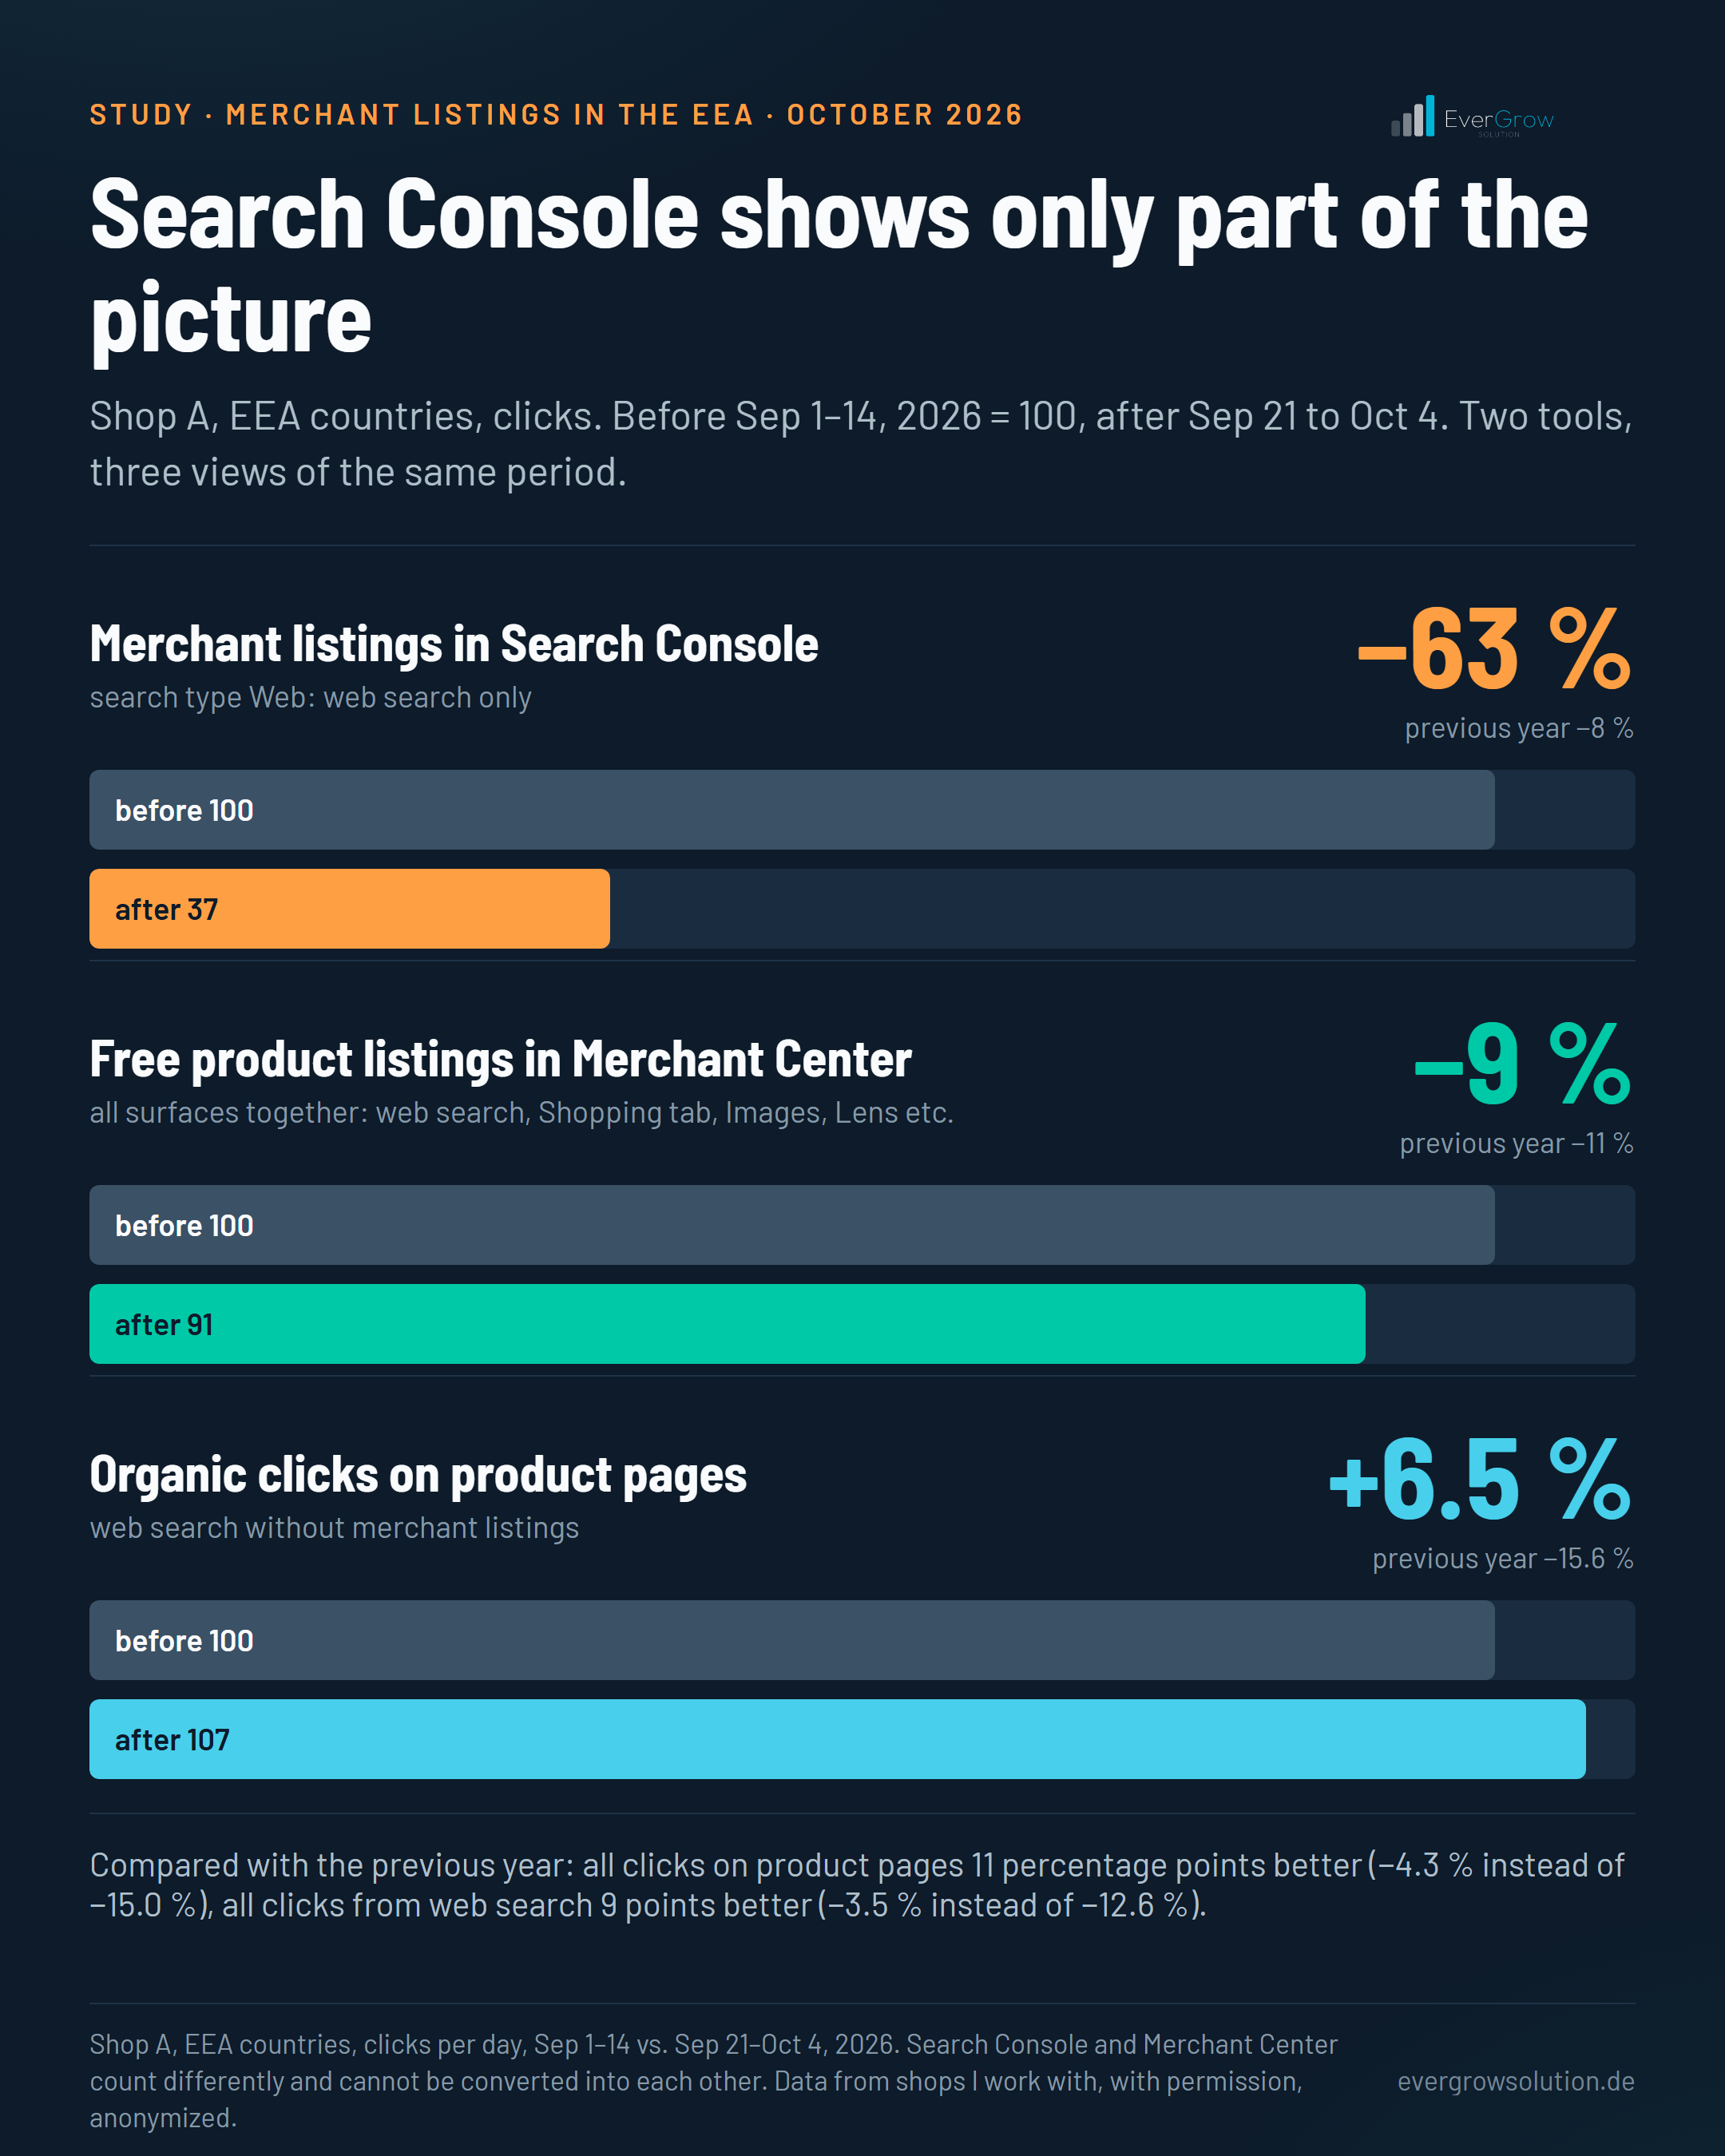
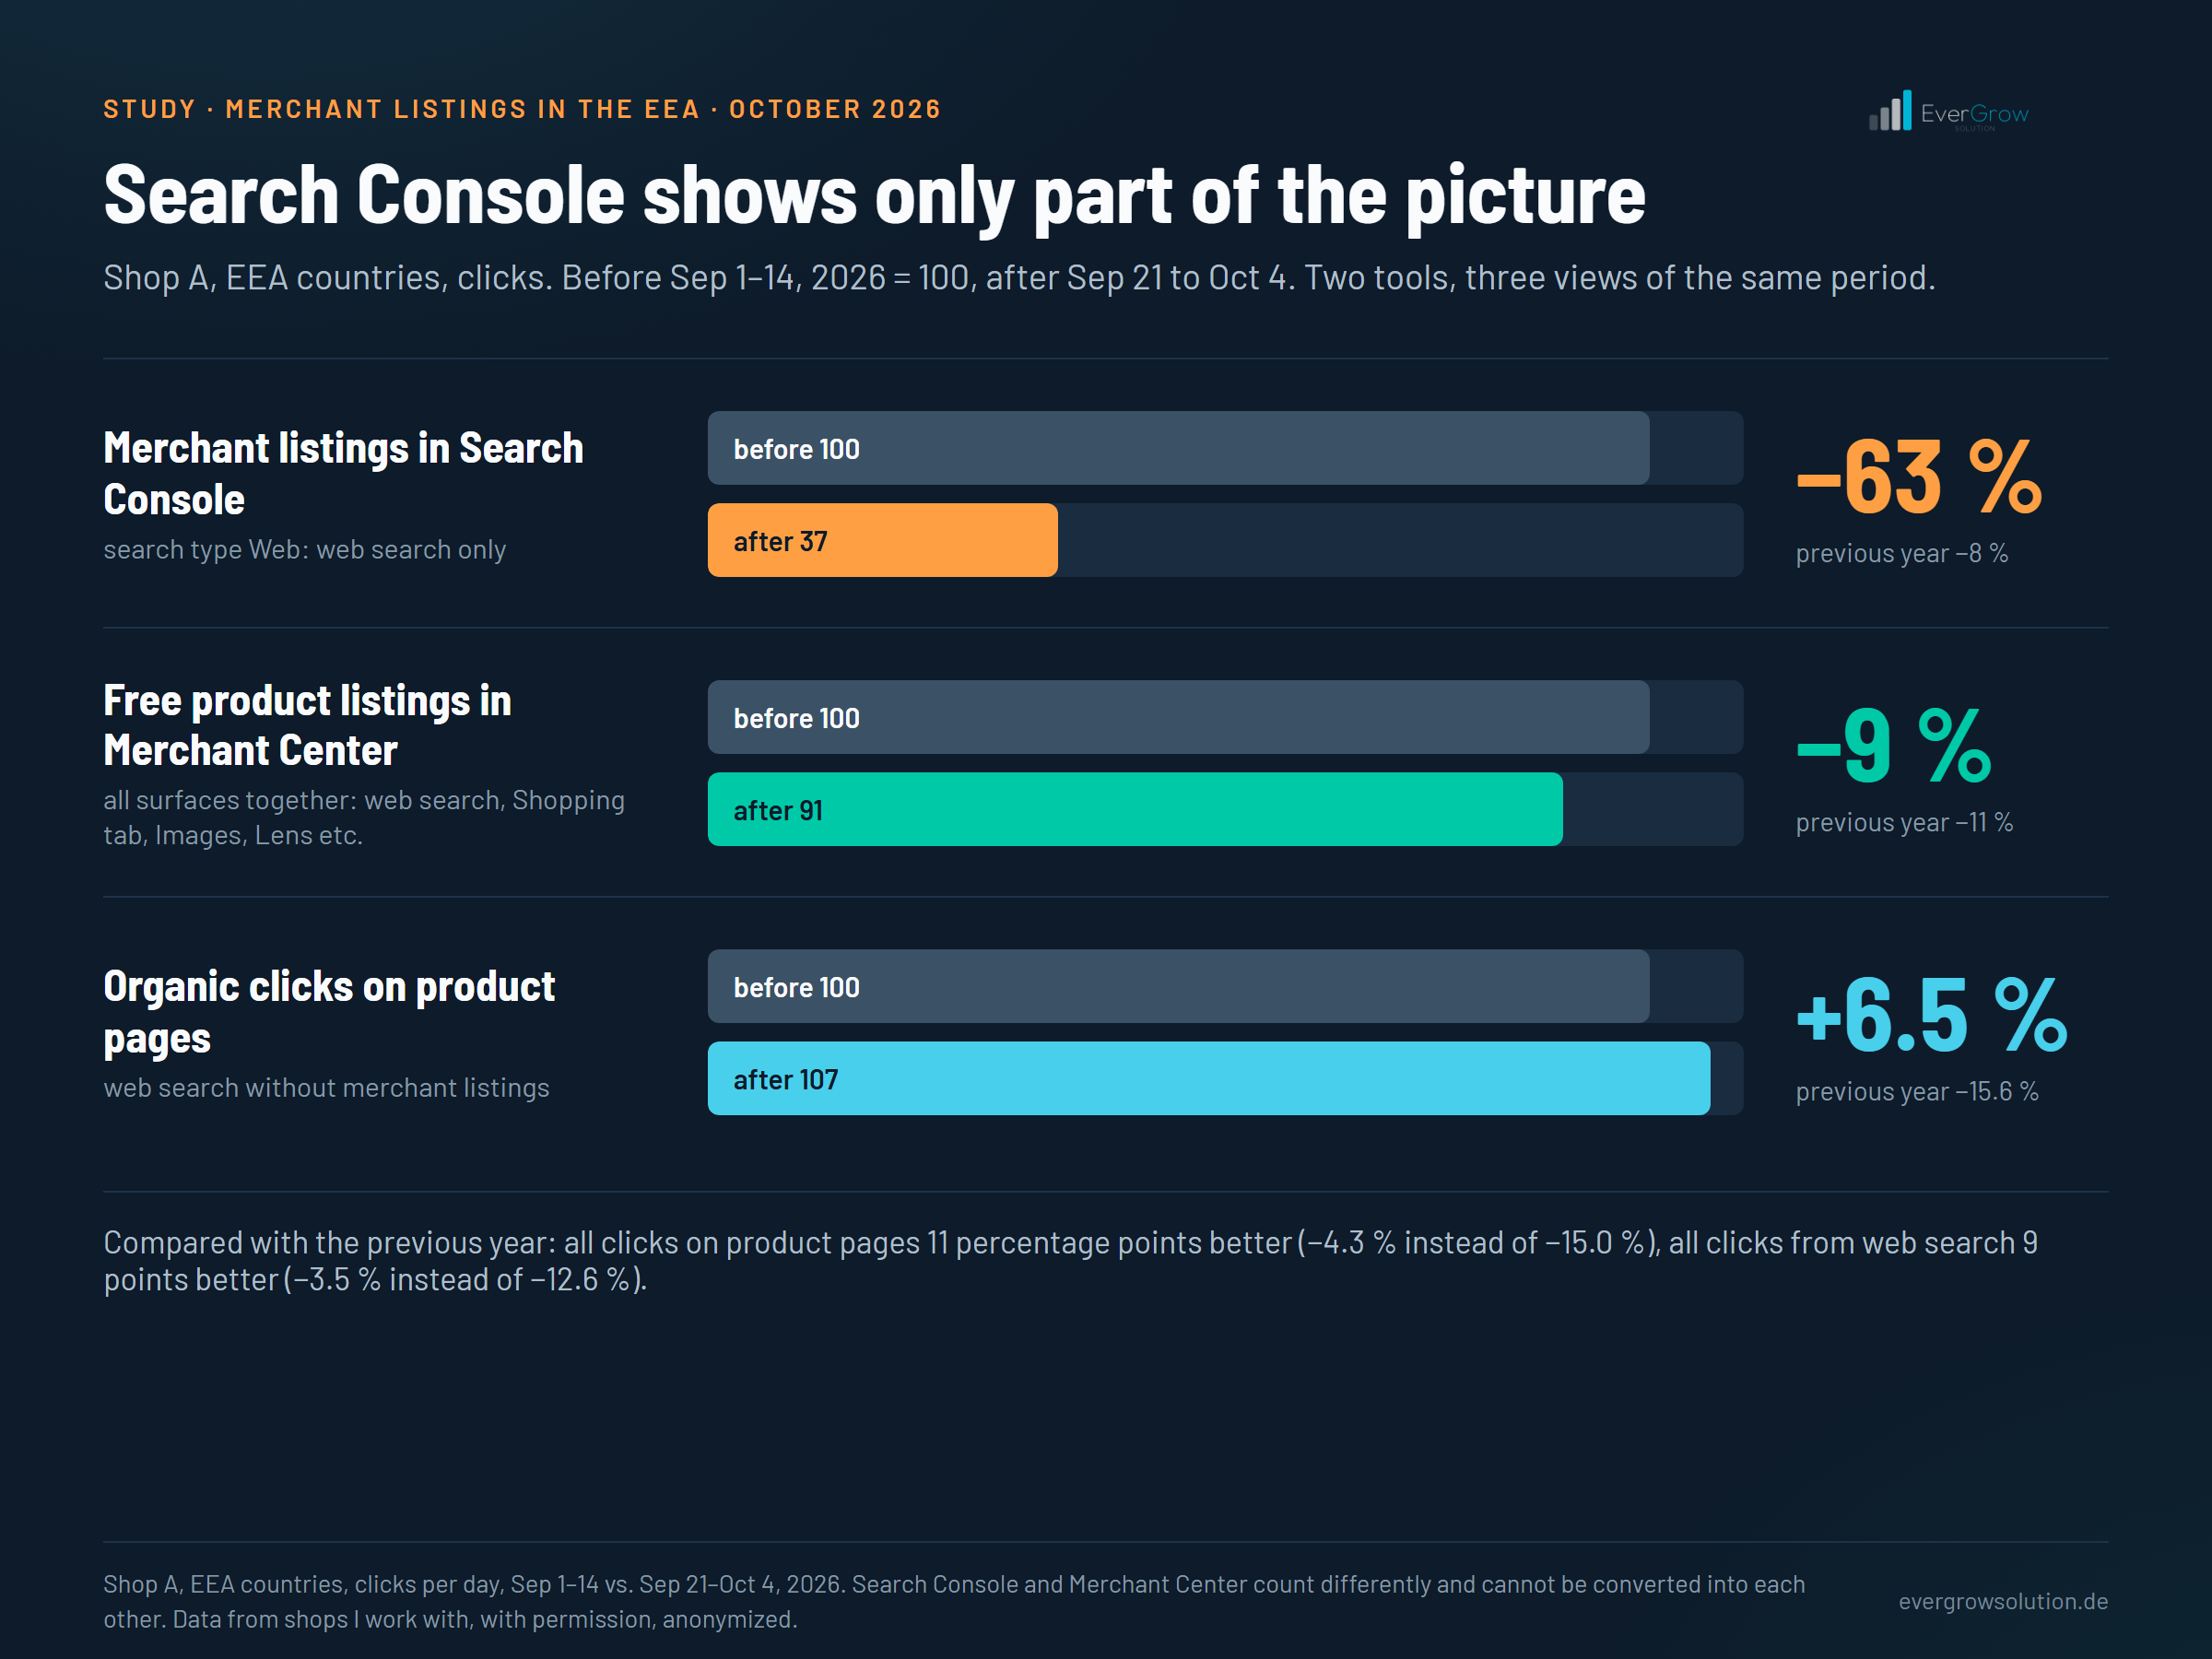
−63 %
Merchant listings in Search Console, Shop A, EEA
clicks Sep 21 to Oct 4 vs. Sep 1 to 14, 2026; Google’s new layout in the EEA; outside the EEA +12 %
−9 %
Free product listings in Merchant Center, Shop A, EEA
clicks, same period; previous year −11 % (older counting)
+6.5 %
Organic clicks on product pages, Shop A, EEA
without merchant listings, same period; previous year −15.6 %, so 22 percentage points better
Own measurements: 531 product searches on four days. Shop data: Search Console, Merchant Center and web analytics of Shop A, with permission, anonymized. Method below.
Data and method
Data: data from shops I work with, with permission (anonymized), here for Shop A, plus my own measurements. I show the shop data only as an index or change, never as absolute numbers.
- My own SERP measurement: 531 product searches (274 in German, 257 in English) from twelve industries, selected by search volume via Google’s Keyword Planner, brand names filtered out. Retrieved on four days, October 20 to 23, 2026, in Germany, Austria and Switzerland (German terms) and the United Kingdom (English terms), on mobile in all four countries, on desktop in Germany and the United Kingdom. 6,440 result pages in total. Retrieved via an interface for search results, signed out, with the location set to the country.
- What was counted: per result page, whether a product block appears; per product item in the block, where it leads (a comparison site group, Google Shopping or directly a shop) and whether it shows star ratings; plus the “Weitere Websites” (“more websites”) block with merchant pages. All product items Google delivers in the block were counted, including those of groups that are not expanded; at first, only the first group is visible.
- Historical SERP captures: 2,299 captures of the same search terms from April to October 2026 from an archive of search result pages, to place the before state and the date.
- Shop data: Search Console, search type Web, search appearance “Merchant listings” and all clicks, per day and country, August to October 18, 2026, plus the clicks on product pages. Merchant Center, free product listings, per day and country. Web analytics for visits via comparison sites.
- Comparison: September 1 to 14, 2026 (before, index 100) vs. September 21 to October 4 (after). As a cross-check, the same period in 2025 and the countries outside the EEA.
- Context (not a control group): search volume in Keyword Planner and Google Trends, Bing clicks and Shopping ads.
What changed on September 15
On September 8, 2026, Google documented two new units for search results in the EEA (Search Engine Journal): one for comparison services such as price comparison sites, where one provider is expanded and the others can be reached through a selection, and one for suppliers themselves. According to Search Engine Roundtable (September 18), Google’s Ads Liaison confirmed in a comment that free product listings were removed in the EEA because of the Digital Markets Act.
In the shop data, the break falls on September 15: clicks on merchant listings in the EEA drop in Shop A within a few days; outside the EEA, they rise by 12 percent. Daily values were already lower from September 9 to 12, on the 11th and 12th in the Merchant Center as well; the step down comes on the 15th. The historical captures fit this: from April to June, 95 to 98 percent of captures from Germany showed a product carousel; from Austria, there are only a few captures around the change, on September 14 with a product carousel, on the 15th and 16th without a product block. There are no captures from Germany between September 6 and 25.
Who fills the new grid
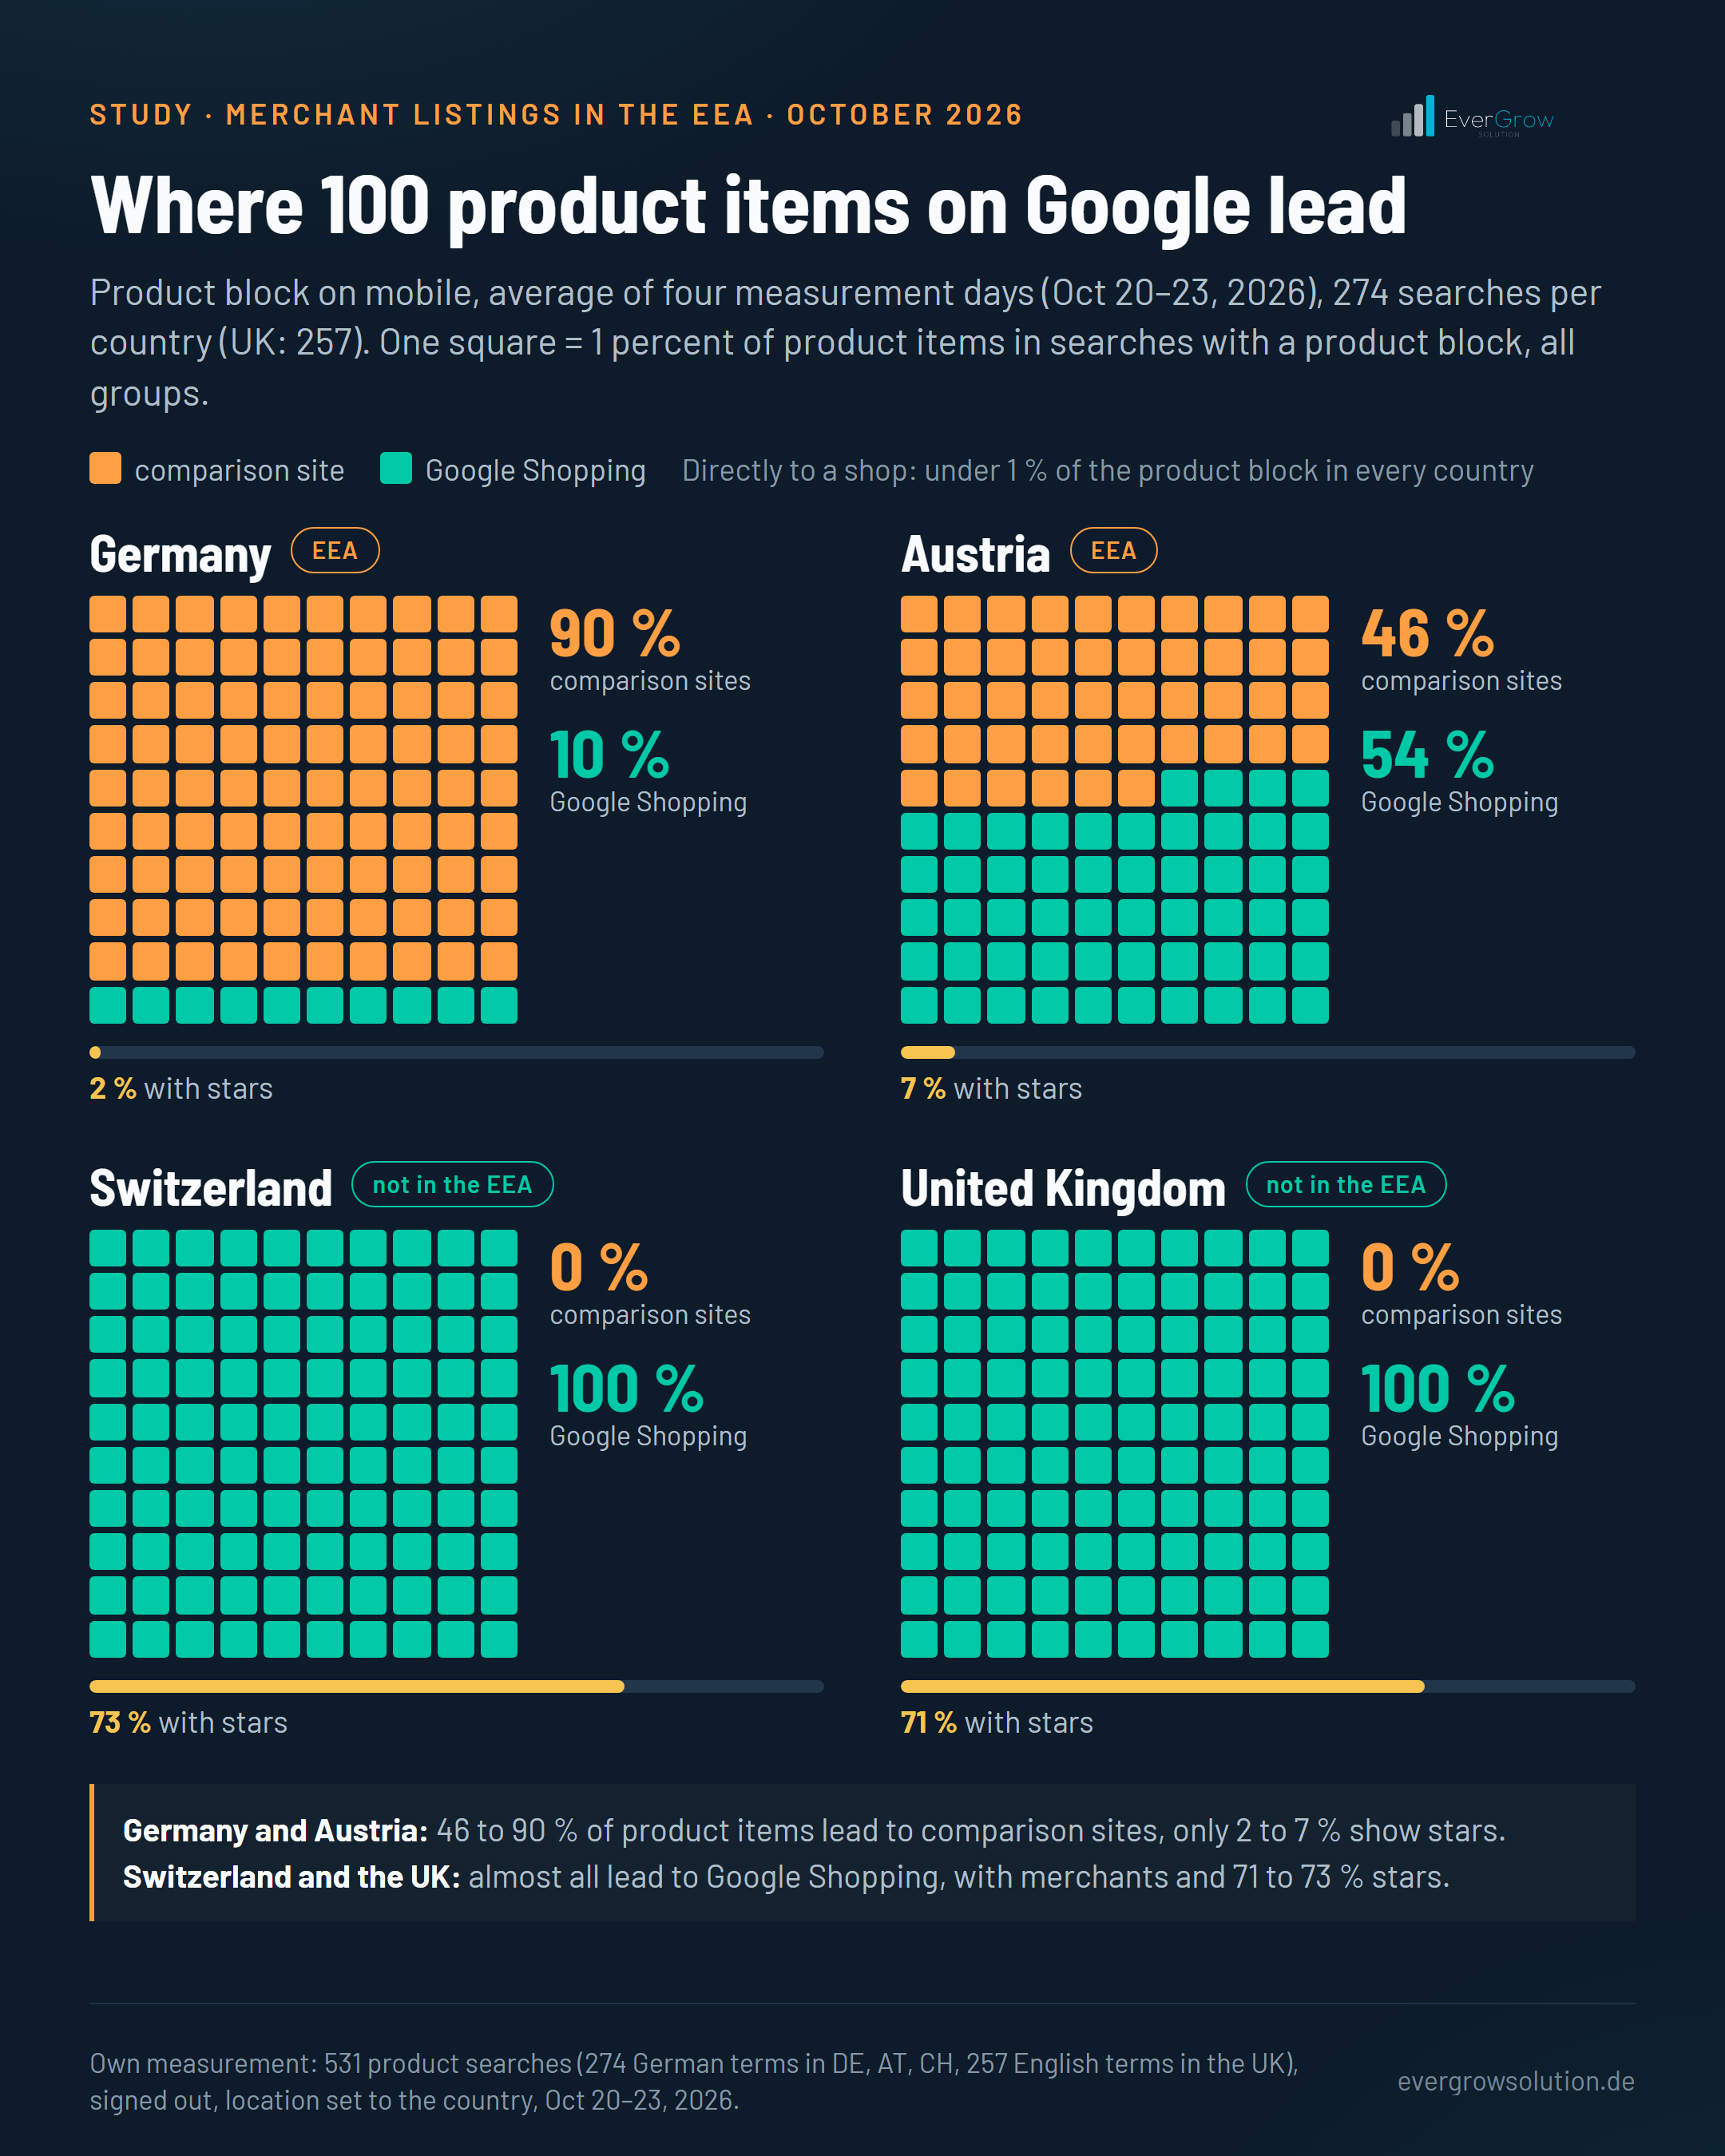
| Country, device | Searches with product block | → comparison site | → Google Shopping | → directly a shop | with star ratings |
|---|---|---|---|---|---|
| Germany, mobile | 92 % | 90 % | 10 % | 0 % | 2 % |
| Germany, desktop | 53 % | 87 % | 13 % | 0 % | 4 % |
| Austria, mobile | 90 % | 46 % | 54 % | 0 % | 7 % |
| Switzerland, mobile | 95 % | 0 % | 100 % | 0 % | 73 % |
| United Kingdom, mobile | 100 % | 0 % | 100 % | 0 % | 71 % |
| United Kingdom, desktop | 100 % | 0 % | 100 % | 0 % | 71 % |
Average of four measurement days (October 20 to 23, 2026). The columns with an arrow are shares of all product items in the block, rounded to whole percent, adding up to 100. In Switzerland and the UK, comparison services also appear as sellers in Google Shopping; they count as Google Shopping here. The shares for comparison sites and Google Shopping varied by about two percentage points per day; on German desktop, however, whether a product block appears at all varies (49 to 57 percent).
In Germany, the grid is almost entirely in the hands of comparison sites; Google Shopping is just one of usually six to eight groups per search. Only a few offers still show star ratings. On mobile, about every third search also shows a “Weitere Websites” (“more websites”) block, mostly with store pages of merchants, and only in Germany and Austria. That fits Google’s description of the new supplier unit (direct providers such as brick-and-mortar businesses, only together with the aggregator unit, only in the EEA). Whether it is exactly that unit, I cannot prove. In Austria, Google Shopping is much stronger at a little more than half. In Switzerland and the United Kingdom, the product carousel is as before: offers with merchant names that lead to Google Shopping, almost three quarters with star ratings.
- Google Shopping 10.0 %
- testberichte.de 6.6 %
- billiger.de 6.3 %
- shopping.de 5.7 %
- idealo.de 5.5 %
- preissuchmaschine.de 5.3 %
- geizhals.de 4.8 %
- vergleich.org 4.5 %
- codecheck.info 4.3 %
- guenstiger.de 4.0 %
The remaining shares are spread across further comparison sites with less than 4 percent each.
An independent measurement shows the same picture: SISTRIX analysed 10.8 million smartphone results from October 7 to 14. There too, Google Shopping is the most frequent provider, ahead of Testberichte.de, and comes first in 17.5 percent of boxes; in my data it is 16.3 percent of mobile grids. Google Shopping still has only 10 percent above because of how it is counted: it appears in 58 percent of my grids (79.7 percent of boxes at SISTRIX), but usually with only a few elements, while the many comparison sites fill the rest. SISTRIX shows who is in the box; this study is about what of it reaches a shop.
What Shop A sees: Search Console vs. Merchant Center
In Search Console, the case is clear. Clicks on merchant listings in the EEA fall by 63 percent in Shop A; in the previous year, the same period showed −8 percent. Outside the EEA, they rise by 12 percent. Merchant listings in the EEA are not entirely gone: the Google Shopping group stays in the grid, and per country Shop A loses roughly 40 to 70 percent, most in Germany. The Merchant Center tells a different story: clicks on free product listings in the EEA fall by only 9 percent; in the previous year, it was −11 percent, still in the older counting. The gap persists in early to mid-October (October 5 to 18 vs. September 1 to 14): Search Console −60 percent (previous year −5), Merchant Center −18 percent (previous year −16).
Values as a table
| Period | Search Console, merchant listings | Merchant Center, free listings |
|---|---|---|
| Aug 9, 2026 | 97 | 99 |
| Aug 10, 2026 | 97 | 99 |
| Aug 11, 2026 | 99 | 99 |
| Aug 12, 2026 | 98 | 99 |
| Aug 13, 2026 | 100 | 99 |
| Aug 14, 2026 | 99 | 99 |
| Aug 15, 2026 | 98 | 99 |
| Aug 16, 2026 | 95 | 98 |
| Aug 17, 2026 | 93 | 97 |
| Aug 18, 2026 | 93 | 96 |
| Aug 19, 2026 | 92 | 96 |
| Aug 20, 2026 | 92 | 96 |
| Aug 21, 2026 | 92 | 97 |
| Aug 22, 2026 | 92 | 96 |
| Aug 23, 2026 | 93 | 97 |
| Aug 24, 2026 | 95 | 98 |
| Aug 25, 2026 | 95 | 99 |
| Aug 26, 2026 | 97 | 100 |
| Aug 27, 2026 | 97 | 100 |
| Aug 28, 2026 | 98 | 100 |
| Aug 29, 2026 | 101 | 102 |
| Aug 30, 2026 | 104 | 103 |
| Aug 31, 2026 | 107 | 105 |
| Sep 1, 2026 | 109 | 105 |
| Sep 2, 2026 | 112 | 107 |
| Sep 3, 2026 | 113 | 107 |
| Sep 4, 2026 | 113 | 106 |
| Sep 5, 2026 | 114 | 106 |
| Sep 6, 2026 | 114 | 105 |
| Sep 7, 2026 | 113 | 104 |
| Sep 8, 2026 | 115 | 105 |
| Sep 9, 2026 | 109 | 104 |
| Sep 10, 2026 | 106 | 104 |
| Sep 11, 2026 | 103 | 102 |
| Sep 12, 2026 | 97 | 99 |
| Sep 13, 2026 | 93 | 99 |
| Sep 14, 2026 | 87 | 96 |
| Sep 15, 2026 | 76 | 92 |
| Sep 16, 2026 | 69 | 89 |
| Sep 17, 2026 | 61 | 87 |
| Sep 18, 2026 | 54 | 87 |
| Sep 19, 2026 | 48 | 86 |
| Sep 20, 2026 | 39 | 84 |
| Sep 21, 2026 | 31 | 83 |
| Sep 22, 2026 | 27 | 83 |
| Sep 23, 2026 | 26 | 83 |
| Sep 24, 2026 | 27 | 84 |
| Sep 25, 2026 | 27 | 84 |
| Sep 26, 2026 | 28 | 86 |
| Sep 27, 2026 | 29 | 88 |
| Sep 28, 2026 | 30 | 91 |
| Sep 29, 2026 | 33 | 93 |
| Sep 30, 2026 | 36 | 95 |
| Oct 1, 2026 | 38 | 95 |
| Oct 2, 2026 | 39 | 94 |
| Oct 3, 2026 | 43 | 94 |
| Oct 4, 2026 | 45 | 94 |
| Oct 5, 2026 | 48 | 92 |
| Oct 6, 2026 | 49 | 89 |
| Oct 7, 2026 | 48 | 87 |
| Oct 8, 2026 | 48 | 87 |
| Oct 9, 2026 | 47 | 87 |
| Oct 10, 2026 | 46 | 86 |
| Oct 11, 2026 | 44 | 85 |
| Oct 12, 2026 | 41 | 84 |
| Oct 13, 2026 | 40 | 84 |
| Oct 14, 2026 | 39 | 83 |
| Oct 15, 2026 | 38 | 81 |
| Oct 16, 2026 | 37 | 80 |
| Oct 17, 2026 | 36 | 79 |
| Oct 18, 2026 | 37 | 79 |
Search Console (search type Web) and Merchant Center of the same shop (Shop A), EEA countries, with permission, anonymized. In absolute numbers, Merchant Center counts a multiple of Search Console, so both are shown as an index. The 7-day average looks back one week: it falls before September 15 because daily values from September 9 to 12 were lower.
The difference lies in what the two tools count. According to Google’s Search Console help, the “Merchant listings” search appearance applies to web search and Google Images; I used the search type Web, so web search only. According to Google’s Merchant Center help, free product listings also appear on the Shopping tab, Google Images, Lens, YouTube and Maps. The Merchant Center reports their organic clicks together and does not separate surfaces. For Shop A, merchant listing clicks in Search Console were only about a fifth of the clicks from free listings in the Merchant Center before. That fits with the drop in Search Console looking so much bigger. It is not a split by surface: the two tools count differently and cannot be converted into each other.
Values as a table
| Period | Shop A, EEA | Shop A, outside EEA |
|---|---|---|
| Aug 9, 2026 | 97 | 111 |
| Aug 10, 2026 | 97 | 109 |
| Aug 11, 2026 | 99 | 108 |
| Aug 12, 2026 | 98 | 108 |
| Aug 13, 2026 | 100 | 114 |
| Aug 14, 2026 | 99 | 116 |
| Aug 15, 2026 | 98 | 119 |
| Aug 16, 2026 | 95 | 122 |
| Aug 17, 2026 | 93 | 124 |
| Aug 18, 2026 | 93 | 122 |
| Aug 19, 2026 | 92 | 123 |
| Aug 20, 2026 | 92 | 123 |
| Aug 21, 2026 | 92 | 124 |
| Aug 22, 2026 | 92 | 121 |
| Aug 23, 2026 | 93 | 122 |
| Aug 24, 2026 | 95 | 120 |
| Aug 25, 2026 | 95 | 121 |
| Aug 26, 2026 | 97 | 119 |
| Aug 27, 2026 | 97 | 117 |
| Aug 28, 2026 | 98 | 114 |
| Aug 29, 2026 | 101 | 113 |
| Aug 30, 2026 | 104 | 112 |
| Aug 31, 2026 | 107 | 112 |
| Sep 1, 2026 | 109 | 109 |
| Sep 2, 2026 | 112 | 110 |
| Sep 3, 2026 | 113 | 108 |
| Sep 4, 2026 | 113 | 109 |
| Sep 5, 2026 | 114 | 108 |
| Sep 6, 2026 | 114 | 107 |
| Sep 7, 2026 | 113 | 105 |
| Sep 8, 2026 | 115 | 102 |
| Sep 9, 2026 | 109 | 100 |
| Sep 10, 2026 | 106 | 103 |
| Sep 11, 2026 | 103 | 101 |
| Sep 12, 2026 | 97 | 99 |
| Sep 13, 2026 | 93 | 97 |
| Sep 14, 2026 | 87 | 96 |
| Sep 15, 2026 | 76 | 97 |
| Sep 16, 2026 | 69 | 97 |
| Sep 17, 2026 | 61 | 95 |
| Sep 18, 2026 | 54 | 94 |
| Sep 19, 2026 | 48 | 96 |
| Sep 20, 2026 | 39 | 96 |
| Sep 21, 2026 | 31 | 97 |
| Sep 22, 2026 | 27 | 95 |
| Sep 23, 2026 | 26 | 94 |
| Sep 24, 2026 | 27 | 97 |
| Sep 25, 2026 | 27 | 101 |
| Sep 26, 2026 | 28 | 101 |
| Sep 27, 2026 | 29 | 107 |
| Sep 28, 2026 | 30 | 110 |
| Sep 29, 2026 | 33 | 116 |
| Sep 30, 2026 | 36 | 120 |
| Oct 1, 2026 | 38 | 120 |
| Oct 2, 2026 | 39 | 119 |
| Oct 3, 2026 | 43 | 121 |
| Oct 4, 2026 | 45 | 117 |
| Oct 5, 2026 | 48 | 116 |
| Oct 6, 2026 | 49 | 114 |
| Oct 7, 2026 | 48 | 109 |
| Oct 8, 2026 | 48 | 105 |
| Oct 9, 2026 | 47 | 101 |
| Oct 10, 2026 | 46 | 98 |
| Oct 11, 2026 | 44 | 94 |
| Oct 12, 2026 | 41 | 90 |
| Oct 13, 2026 | 40 | 86 |
| Oct 14, 2026 | 39 | 86 |
| Oct 15, 2026 | 38 | 85 |
| Oct 16, 2026 | 37 | 85 |
| Oct 17, 2026 | 36 | 84 |
| Oct 18, 2026 | 37 | 85 |
Search Console, search type Web, search appearance = merchant listings, Shop A, with permission, anonymized. Outside the EEA, the autumn trend shows no break.
What organic product pages make up for
For Shop A, I also analyzed clicks on product pages from web search in the EEA. Before September 15, merchant listings were about 15 percent of these clicks. The remaining organic clicks on product pages rose by 6.5 percent afterwards; in the previous year, they fell by 15.6 percent in the same period. All clicks on product pages together were at −4.3 percent, compared with −15.0 percent in the previous year. By calculation, the organic gain made up for about 57 percent of the decline in merchant listings on these pages. Compared with the previous year’s trend, Shop A is 11 percentage points better on all clicks on product pages (−4.3 instead of −15.0 percent) and 9 points better on all clicks from web search (−3.5 instead of −12.6 percent).
In early to mid-October (October 5 to 18 vs. September 1 to 14), organic clicks on product pages fell much less than in the previous year (−4.4 vs. −23.6 percent), all clicks on product pages by 13.8 percent (previous year −21.8). The calculated offset through a gain applies to the first period. Across all pages, organic clicks without merchant listings stayed at the before level in the first period (+0.1 percent, previous year −12.9). Whether the same users switched from the merchant listing to the regular search result cannot be separated from the data; demand in September was about at the previous year’s level.
| Shop A, change | 2026 | Previous year | vs. previous year |
|---|---|---|---|
| Organic clicks on product pages | +6.5 % | −15.6 % | +22 pp |
| All clicks on product pages | −4.3 % | −15.0 % | +11 pp |
| All clicks from web search | −3.5 % | −12.6 % | +9 pp |
| Visits via comparison sites (web analytics, all countries and media) | +13.3 % | +4.8 % | +9 pp |
| Free product listings (Merchant Center) | −9.2 % | −10.6 % | +1 pp |
| Merchant listings (Search Console, search type Web) | −62.9 % | −7.9 % | −55 pp |
September 21 to October 4 vs. September 1 to 14, previous year the same calendar days in 2025. Clicks in the EEA, except for comparison sites. Merchant Center still counts the previous year in the older counting; both values are changes within the same year. pp = percentage points. Product pages identified by URL pattern; organic means without the “Merchant listings” search appearance.
What else moved, and what stayed the same
- Comparison sites: visits via comparison sites to Shop A in web analytics +13 percent, previous year +5 percent (all countries and mediums together). Whether these are clicks that used to come through merchant listings cannot be separated from this.
- Demand: Keyword Planner, September vs. August: Germany +22, Austria +23, Switzerland +4, United Kingdom +6 percent; vs. September 2025: +2, +5, −3, +15 percent. Google Trends shows no dip for 20 terms in Germany and the United Kingdom.
- Bing: clicks for Shop A +1 percent, no break.
- Shopping ads: in Shop A’s ads data, no jump on September 15 and no decline limited to the EEA. Google’s description of the new units does not mention Shopping ads, as Kelkoo also points out.
My recommendations for shops in the EEA
From the measurements, I derive five points. They are my assessments, meant for shops in the EEA in general.
- Read Search Console and Merchant Center together, per country. The drop in Search Console is not your total loss.
- Deliver complete Product markup: price, availability, variants. Product snippets are the web search surface you influence through your own pages.
- Be listed on comparison sites. In Germany, 90 percent of product items in the new grid lead there. If you are not listed there, you are only visible in the grid through the Google Shopping group. Most portals charge per click.
- Keep tracking parameters such as srsltid through redirects (Merchant Center auto-tagging) and check how your web analytics attributes visits from free listings. Otherwise the channel is hard to measure separately.
- Assess Shopping ads separately. Shop A saw no break there on September 15. Kelkoo expects paid Shopping and partnerships with comparison sites to matter more in the EEA. Whether that pays off for you is a budget question, not an SEO question.
Limitations
- One shop in detail. The shop values apply to Shop A, not to the market. My own SERP measurement, on the other hand, is broad (531 searches).
- Choice of searches: 531 high-volume, non-brand product searches from twelve industries, not a representative sample of all searches; the UK with its own English terms.
- Baseline: with a different baseline, the picture stays similar. Against August 18 to 31, Shop A is at −63 percent (Search Console) and −10 percent (Merchant Center), against September 1 to 8 at −68 and −14 percent.
- Automated retrieval: what an automated, signed-out retrieval sees can differ from what a person sees. That is why there are four measurement days: 1,400 of 1,610 combinations of search, country and device (87 percent) showed the same result every day on whether a product block appears; on German desktop, just under half.
- The Merchant Center does not separate surfaces. Which share of the remaining free clicks comes from the Shopping tab, from Images or elsewhere cannot be read there. The “about a fifth” share divides two differently defined counters. Google changed the counting in the Merchant Center on August 24, 2026 and recalculated values from July 1 (Merchant Center help); the before and after periods are both later, the previous-year values come from the old counting. For Shop A, the switch on July 1 shows no jump.
- Product pages: identified by the URL pattern of Shop A’s product pages. Organic clicks here means all clicks from web search on these pages without the “Merchant listings” search appearance.
- Period: two weeks before, two weeks after, plus October 5 to 18. Only a repeat will show whether the picture shifts in the coming months.
- Date of the change: there are no historical captures from Germany between September 6 and 25. September 15 is supported by the shop data and a few captures from Austria.
Strength of evidence at a glance
| Claim | Evidence |
|---|---|
| New grid in Germany: 90 % of product items to comparison sites, 10 % to Google Shopping; product carousel in Switzerland and the United Kingdom | shown (four days, October) |
| Break on September 15, only in the EEA | supported (shop data, few captures) |
| Shop A: Search Console −63 %, Merchant Center −9 % (previous year −11 %, older counting) | shown |
| Organic clicks on product pages in Shop A +6.5 % (previous year −15.6 %), early to mid-October −4.4 % (previous year −23.6 %) | shown |
| Shop A against the previous year: product pages +11 pp, web search +9 pp | shown |
| Merchant listing clicks in Search Console equal 19 % of free clicks in Merchant Center for Shop A; no split by surface | calculated (two counters) |
| Organic gain on product pages made up for about 57 % of the decline in merchant listings on product pages in Shop A by calculation (Sep 21–Oct 4) | calculated |
| Whether the same users switched from the merchant listing to the organic result | open |
Sources
- Search Engine Journal: Google Rolls Out Redesigned Search Results Across The EEA, September 8, 2026 (units for comparison services and suppliers, documentation by Google on the same day).
- Barry Schwartz: Report on the removal of free product listings in the EEA, Search Engine Roundtable, September 18, 2026, with measurements from Productrise and Semrush and the confirmation by Google’s Ads Liaison in a comment.
- Johannes Beus: Googles EU-Vergleichsbox: Der häufigste Anbieter ist Google selbst (German), SISTRIX, October 14, 2026, updated October 22 (10.8 million smartphone results, October 7 to 14, seven countries).
- Kelkoo Group: Google’s new aggregator unit in the EU: what merchants need to know, October 5, 2026.
- Google: Free product listings in the Merchant Center help (surfaces Google Search, Shopping tab, Google Images, Lens, YouTube, Maps).
- Google: Performance report (search results): dimensions and data grouping in the Search Console help (“Merchant listings” applies to the search type Web and to Google Images).
- Google Search Central: Supplier unit in Google Search (unit for direct providers, only together with the aggregator unit, only in the EEA).
- Google: Changes to performance reports in the Merchant Center help (counting from August 24, 2026, values recalculated from July 1).
- Own data: measurement of 531 product searches on four days (October 20 to 23, 2026) and historical captures April to October 2026; Search Console, Merchant Center and web analytics of a shop I work with (Shop A), with permission, anonymized; search volume via Google’s Keyword Planner.